Strength of Materials
Intro
First off, know that this is a semi-simplified explanation. This is at least a semester's worth of information fit on one page and people spend carreers going in-depth on this. The hope is that it will give a novice some working knowledge to use, a rusty professional a reminder, or simply some keywords to look up to find more infomation if desired.
Strength of Materials deals with the bending and breaking of machine elements. All materials deform under stress. Stress is a force over a certain area acting on an object. The deformation that occurs is referred to as Strain. Strain is a measurement of the dimensional changes of an object under stress. Think of the length of a rubber band as you pull on it or a marshmallow as you squeeze it.
If you were to pull on a piece of material until it broke and measured stress and the corresponding strain at a bunch of points along the way, you could put together a really nice Stress-Strain Diagram. It would look something like the one below and actually is one method material scientists use to test materials.Stress is plotted along the X-axis and strain along the Y-axis. The resulting curve tells a story. Different materials will have different plots, but the general shape and the deformation modes remain the same.
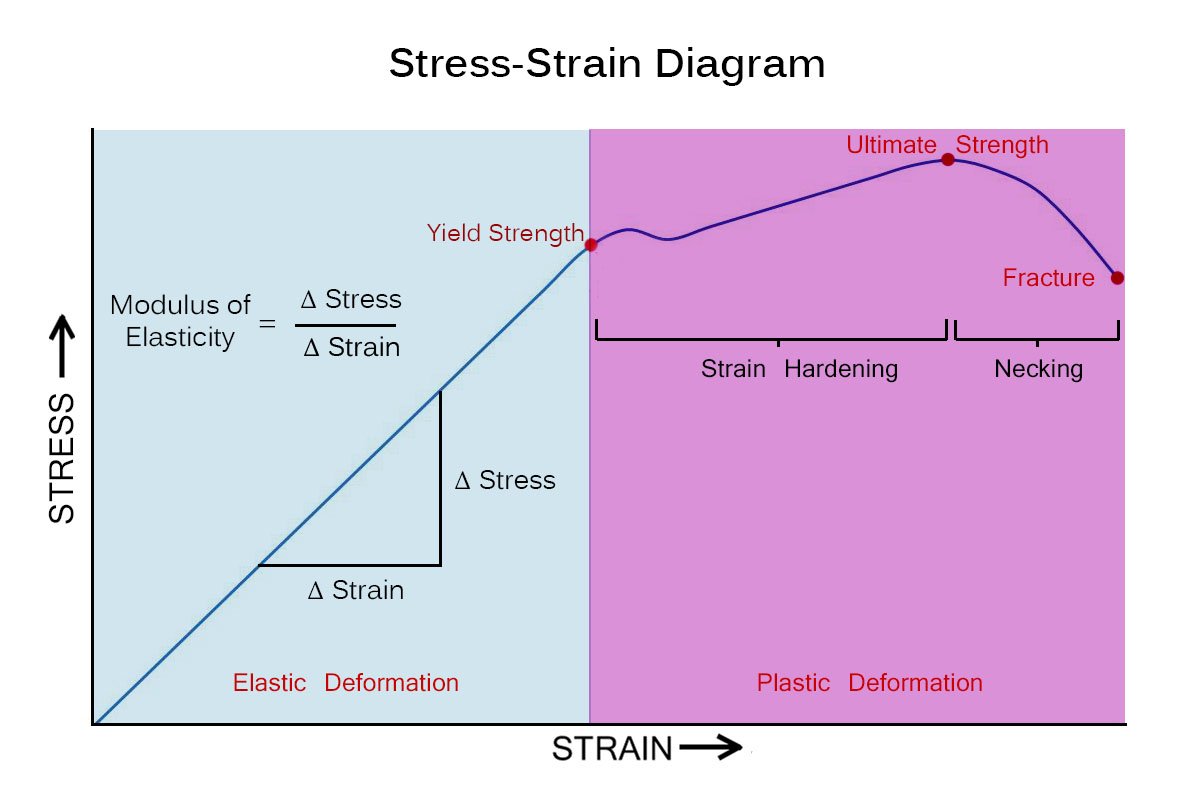
First, a material will undergo Elastic Deformation. This is where the material will spring back to it's original size and position after the stress is removed. This is represented in the first linear section of the stress-strain diagram, represented by the blue area.
When the stress reaches the material's Yield Point, failure begins and the material will act differently under stress than it did before. At this point the material will start to undergo Plastic Deformation, represented by the red area. This is where the material will remain deformed after the stress has been removed. You will notice that after this point, the curve still goes up for a little bit and at a gentler slope. This shows that the material can take additional stress after yielding and stiffness has increased. It is in theis region the material will experience Strain Hardening.
The tippy top of the curve represents the material's Ultimate Strength. After this point things go downhill quickly. The material will start Necking just before it eventually Fractures, breaking into two.
There are a few important numbers we can get from this sort of diagram that help in machine design:
Modulus of Elasticity
A material's Modulus of Elasticity (also known as elastic modulus or Young's modulus) is a measure of its resistance to bending. The higher the number, the stiffer that particular material is. The units are the same as pressure; units of force over units of area, so it is a constant regardless of the shape of the material. This property is essentially like the spring constant of the material as it undergoes elastic deformation. Any type of structural design will want to make sure the material stays in this elastic range. You can also use this number to figure out how far an element will deflect based on a specific load, as we'll get into below.
Yield Strength
The Yield Strength, or Yield Stress, of a material tells you the maximum stress a material can handle and still remain elastic. This is also given in pressure units. This is the number you would use if you wanted to figure out the most weight you could hang off a bracket or the maximum amount you could stretch a spring before it permanently deforms.
Ultimate Strength
The Ultimate Strength, or Ultimate Stress, of the material will tell the point failure will begin. In a structural design, you would never want to get close to this, but in metal forming applications, for example, where you want to permanently deform the material, this is a number you want to pay attention to. It is also given in units of pressure.
Other Properties
In our little hypothetical example above, we pulled on the piece and plotted corresponding stress and strain. If you were to twist the piece or compress the piece, you would end up with different curves for the same material that would show you different properties. From a torsional test (twisting the piece), for example, you could determine the Shear Modulus (or Modulus of Rigidity).
What to do with all this
The above information is of no real practical use on its own, but is essential to shed light on a particular situation. A common situation that we will now explore is Beam Loading. It is one of the simpler applications of this stuff and very useful.
Beam Loading
Imagine you put an eight foot long 2x4 spanning two cinder blocks and then stood on it in the middle. You know it would sag, and depending on how big you are, it might break. You intuitively know that if you moved the blocks closer together, the board would bend less, but you can actually calculate how far it will sag if you know four things:
The Load
How much weight you are putting on it and how it's loaded. Is it a single point load or is it distributed?
The Span and Supports
How far between the supports? What kind of supports are they? Cantilevered? Simple? Fixed?
The Material's Modulus of Elasticity
The material property we talked about above.
The Beam's Second Moment of Inertia
This is a function of the size and shape of the beam itself. It is abbreviated I and can also be called the Second Moment of Area. Depending on the geometry formulas can be used to calculate I or, for common shapes, found in a table. Below you can see a couple formulas and a table from the MDR Beam Loading Cheat Sheet:
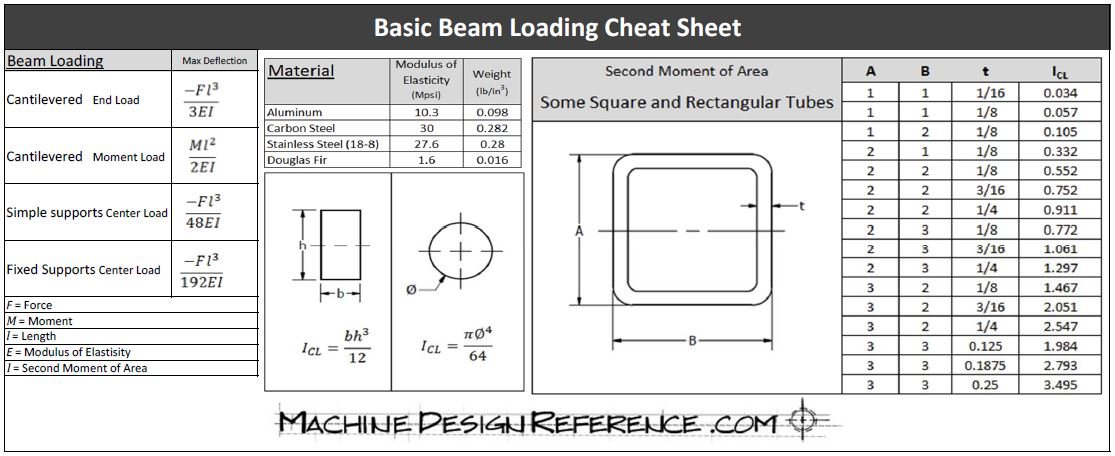
So for our example, we'll say you weigh 150 lbs. The beam is simply supported 96 inches apart and made of Douglas Fir, which has a Modulus of Elasticity of 1.765 x 10⁶ lb-in2. We can calculate the Second Moment of Inertial by multiplying the base by the height cubed and dividing by 12. So a 2x4 (actually 1.5" x 3.5") laying flat would have an I of 0.984 in4. Using the formula for a simply supported beam with a center load found on the cheat sheet, we calculate that the beam will deflect 1.59 inches.
If you were to flip the 2x4 up on edge and then stand on it, the deflection would only be 0.292 inches because the I of the beam in that orientation is 5.359 in4,over 5 times as stiff!
Now let's say that you bought a 2x4 that was made from White Pine because it was cheaper. The E of White Pine is 1.240 x 10⁶ lb-in2. That's a bit less than the Douglas Fir and so recalculating (with the 2x4 on edge), the deflection would be 0.416, an increase of about 1/8 of an inch. In this example, you probably wouldn't even notice the difference, but in the right circumstances it could mean a lot.
For even more fun, let's clamp the ends of the 2x4 to the top of the cinder blocks, making them fully supported. The deflection (Douglas Fir beam on edge) would then be only 0.073 inches!
Below is a list of links to get you going with some formulas, properties, and calculators. A simple Google search of any of these terms will bring up all the information you could ever hope for, but I hope this was a worthwhile read.
Resources:
Beam Design Formulas With Shear and Moment Diagrams. From the American Wood Council. The formulas work for any beam material or shape.
Section Property Calculators. Including Second Moment of Inertia.
I have yet to find a table of material properties that I am happy with. I will make one, but untle then, google works.